Abstract
Background: Understanding the mechanism of clinical success, or failure, of immune checkpoint blockade (ICB) in patients with cancer is essential for progress. We previously reported transcriptomic changes of T cells in patients with relapsed or refractory acute myeloid leukemia (R-AML) receiving the novel combination of pembrolizumab and the hypomethylating agent (HMA) decitabine (NCT02996474). Single cell RNA-sequencing (scRNA-seq) in combination with oligonucleotide-conjugated antibodies (AOC) allows profiling of transcriptomic and immunophenotypic heterogeneity, but this approach is unable to incorporate spatial context within the bone marrow (BM) niche. Here, we combine scRNA-seq plus AOC with emerging spatial-transcriptomic techniques to investigate the spatial-temporal interactions between T cells and leukemia cells in R-AML during treatment with ICB and HMA at single-cell resolution.
Methods: BM samples were collected from 10 R-AML patients at baseline, 8 days after the first dose of pembrolizumab just prior to decitabine initiation (C1D8), end of cycle 2 (EOC2), and relapse (if applicable). 10x Genomics 3' scRNA-seq with 46 AOC was performed on BM aspirate to deeply characterize immunogenomic characteristics of each sample. Using parallelly collected BM biopsy samples, spatial-temporal analysis was conducted on 6 patients at baseline, C1D8, and EOC2 via two NanoString spatial-transcriptomic platforms: (1) CosMx Spatial Molecular Imager to profile 1,000 immuno-oncology related genes at a single-cell resolution and (2) GeoMx Digital Spatial Profiler for transcriptomic profiles and TCR clonalities of tumor-interacting T cells, bystander T cells, and other cells. 10x data were integrated and clustered based on gene expression with annotation determined by top differential proteins. The heterogeneity of patients was explored by comparing cell type distributions and cells expressing leukemia-associated immunophenotypes. Spatial genomics data were mapped to 10x UMAP reference for cell type identification, with distance between cells calculated. The distribution of distance between an individual leukemia cell and the nearest T cell was compared among patients and time points.
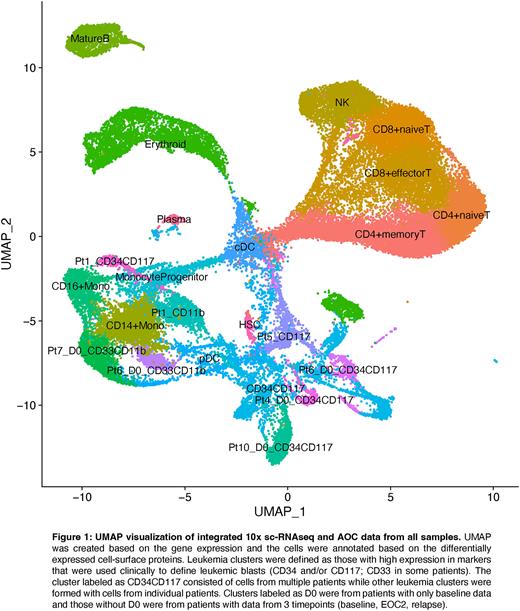
Results: A total of 52,193 cells remained after quality control for scRNA-seq with AOC, with a median of 3,791 cells per patient sample. Cell surface protein differential expression analysis identified 12,301 leukemia cells, accounting for 24% of all cells (Figure 1). Heterogeneity within the leukemia clusters was observed, with 69% falling into distinct clusters by patient. Highly expressed cell surface markers on leukemia clusters were identified including both previously known (CD34, CD117, CD13, CD33) and newly identified (CD123, CD133, CD244, CLEC12a, CD226, and CD69) markers. When comparing baseline samples between patients, we identified markers that were highly expressed in the 3 patients experiencing an anti-leukemic effect (Pt1,5,10: CD133, CD13, CD99, HLA-DR, and HLA-ABC) and in the 3 patients experiencing immune-related adverse events (Pt2,3,5: CD184, CD274, and CD90). Longitudinal data at 3 timepoints over the course of treatment for 2 responding patients (Pt1,5) confirmed the immunophenotypes of the persistent clones (Pt1 as CD34+ CD117+, Pt5 as CD117+).
Spatial transcriptomic data from 6 patients (Pt1,3,4,6,9,10) at 3 timepoints included 528,655 total cells, with a median of 3,622 cells per field of view. By mapping the spatial transcriptomic gene expression signature onto the scRNA-seq reference, 45% of cells were identified as leukemia and 14% as T cells. The percentage of leukemia cells from baseline to EOC2 decreased in the two responders (Pt1: 13-12-7%; Pt10: 50-30-0.5%), validating the relative accuracy of the label transfer between methods. While the transcriptomic and immunophenotypic profiles of the leukemic clones remained stable, the spatial distribution and the transcription profiles of T cells showed dynamic changes during treatment, especially in T cells close to leukemia cells.
Conclusion: We show that integrating complex single cell proteogenomic analysis with spatial-temporal multiomic analysis in patients with AML is feasible and may deeper understanding of interactions between leukemia cells and immune cells in the BM niche. This approach to understand immunotherapy responses may also be generalizable to other malignancies.
Disclosures
Divakar:NanoString Technologies Inc.: Current Employment, Current equity holder in publicly-traded company. Reeves:Nanostring Technologies, Inc.: Current Employment, Current equity holder in publicly-traded company. Hourigan:Mission Bio: Other; Qiagen: Other; TwinStrand Biosciences: Other; Archer Diagnostics: Other; Sellas Life Sciences (Inst): Research Funding.
Author notes
Asterisk with author names denotes non-ASH members.


This feature is available to Subscribers Only
Sign In or Create an Account Close Modal